Using the spectrum analyser
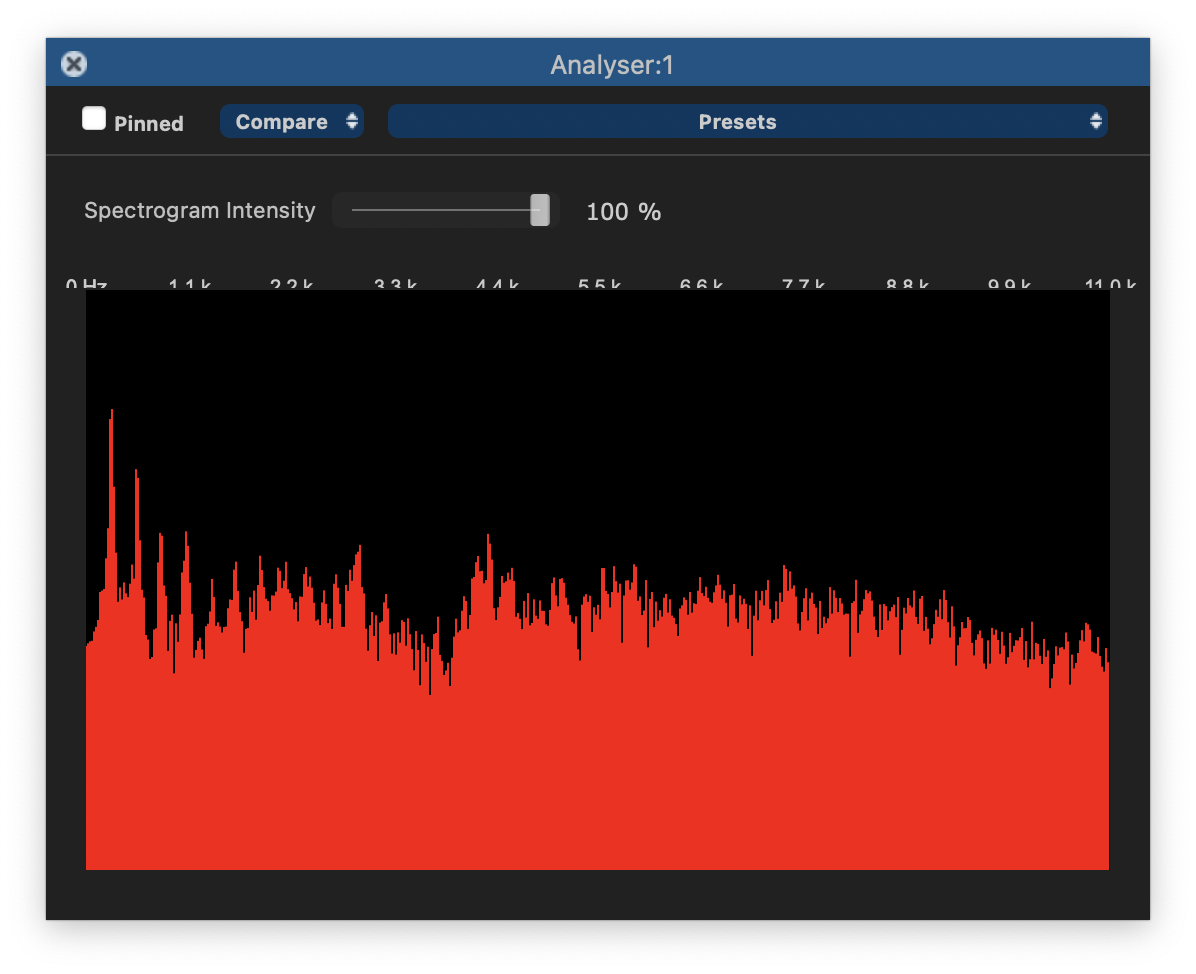
The simple spectrum analysis display shown in the process control panel above shows the short-term frequency spectrum of the signal at the current play head position. It will change as you move the play head, either while audio is playing, or while you scrub replay or move the play head position.
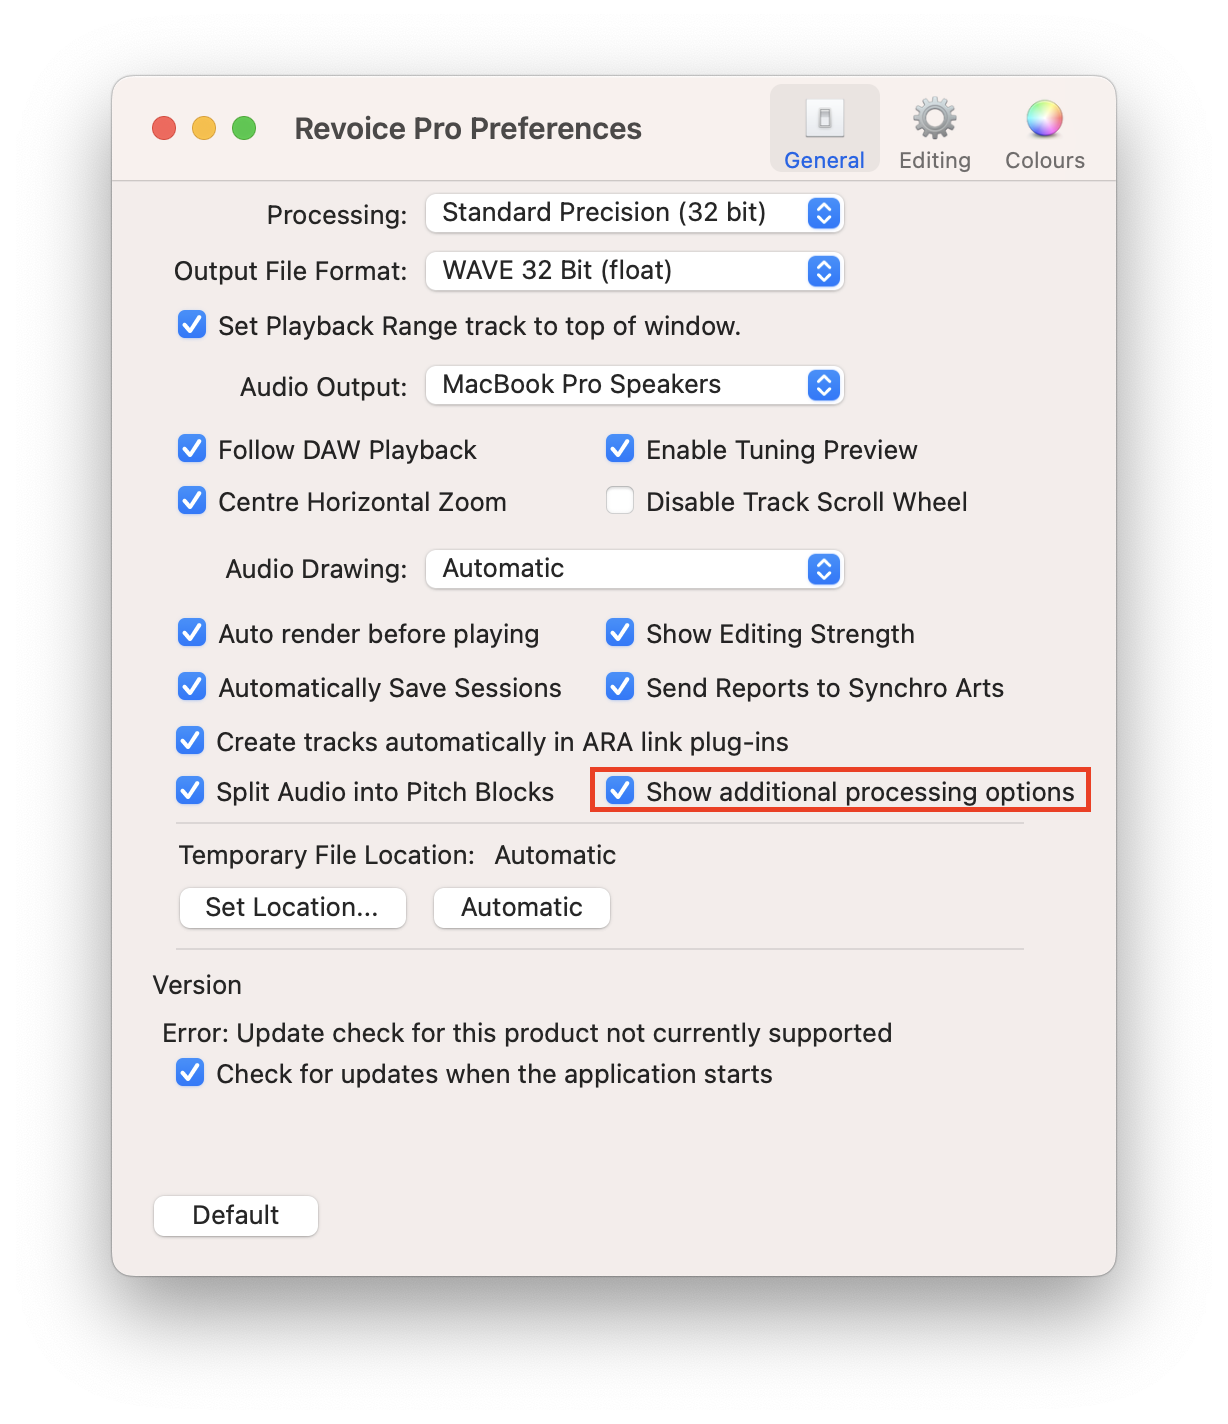
In order to create an Analyser Process, 'Show additional processing options' must be checked in the Settings panel.
The Analyser process can display a spectrogram that represents the spectral density of the audio signal over the duration of the process in question (governed by the process start and end times).
Adjust the Spectrogram Intensity control to affect the visibility of this, superimposed on the audio track in question. In the picture below it is superimposed at 100%, so the audio underneath has been made invisible.
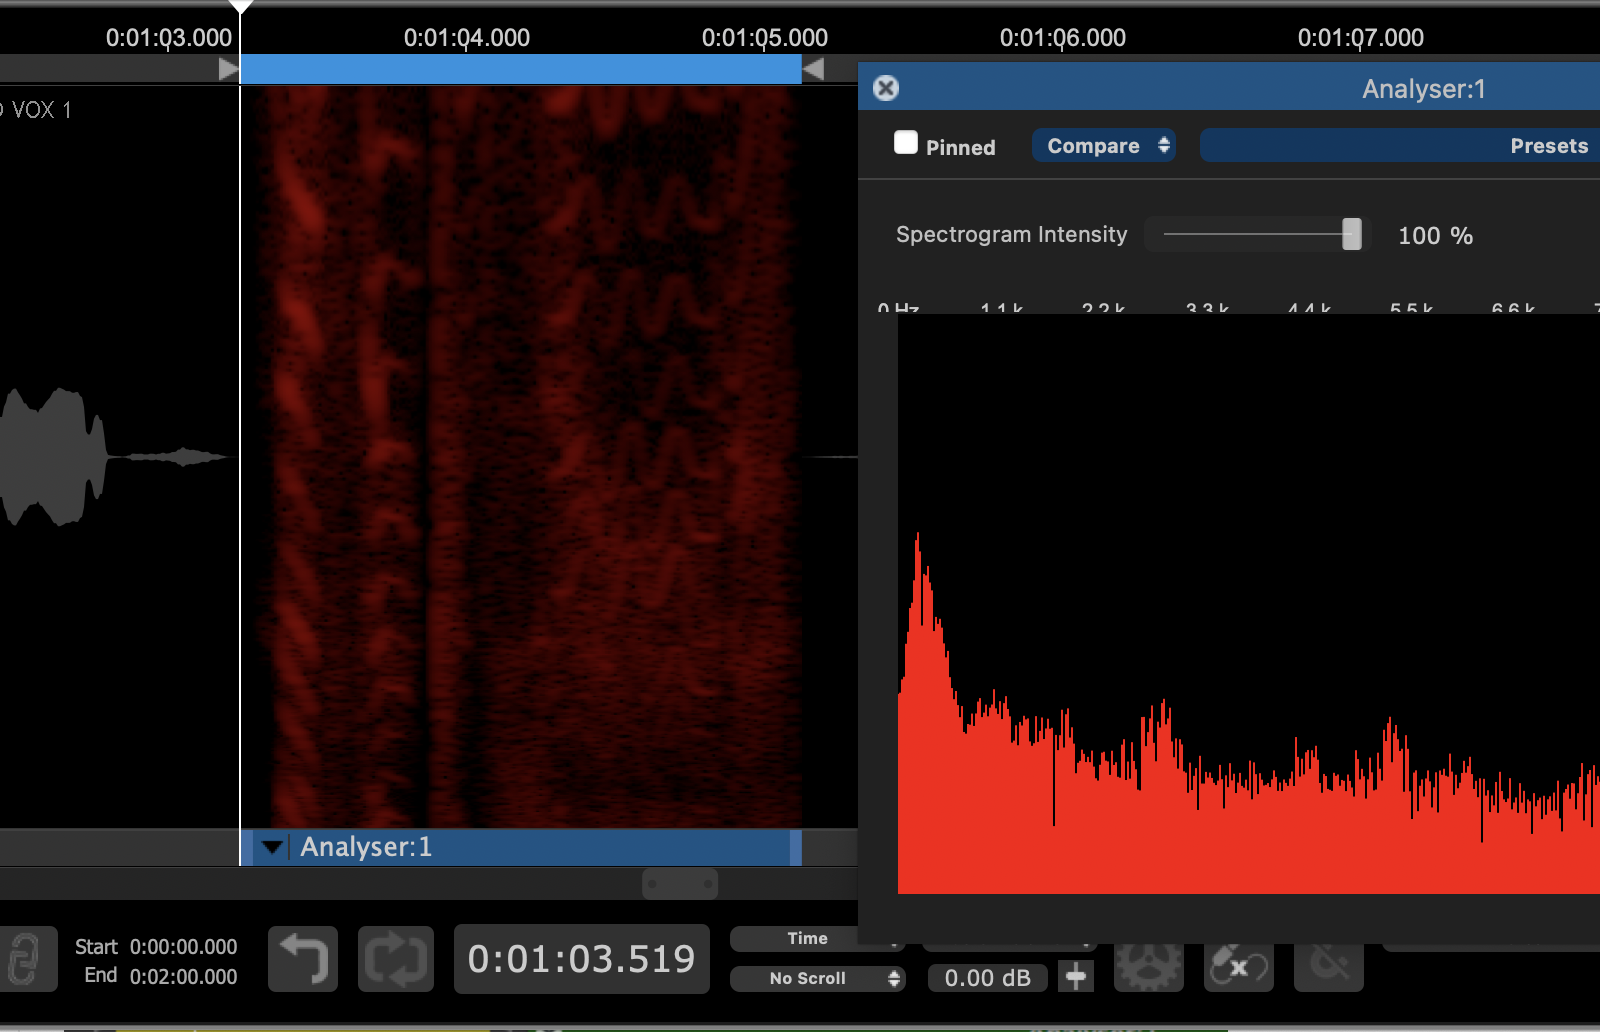
In a spectrogram the horizontal axis represents time, the vertical axis represents frequency, and the intensity of colour represents the amplitude. Here you can see a brighter band that shows the dominant pitch in the vocal track analysed rising towards the middle, then falling in steps.
You can scroll up and down this spectrogram using the mouse wheel to see different parts of the frequency range. For example, by scrolling upwards on the above display it is possible to see the higher harmonics evolving over time:
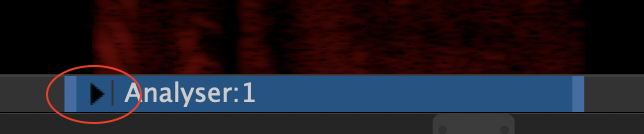
By pressing P or clicking the arrow button on the left side of our Analyser process shown below, we can open the Analyser control panel.
In the Analyser control panel, we can see a display showing the relative power of each frequency at the moment selected by our playhead. The frequencies will dynamically adjust on playback.